Generating ERDs with LLMs: A Shortcut to Understanding Data Structure
Using LLMs to generate entity relationship diagrams has changed how I work with data structure. What used to take weeks of back-and-forth with developers can now happen in a single conversation — giving you both readable code and visual diagrams you can actually use.

I stumbled into this workflow almost by accident. I was brainstorming a new project with Claude, working through what data I'd need to track, and it offered to generate an entity relationship diagram for me using Mermaid. I said yes without thinking much of it, and when I saw the output, something clicked — this wasn't just a nice visualisation. This was a practical asset I could actually use.
Since then, I've been using LLM-generated ERDs in two distinct ways: as a brainstorming tool when starting new projects, and as a documentation tool when I need to understand existing systems quickly. Both have changed how I work with data structure, particularly when collaborating with development teams.
Why Mermaid specifically matters
When you ask an LLM to describe database relationships, you could get back a text explanation. That's useful, but limited. Mermaid gives you something better: code that's both human-readable and renders into a visual diagram.
Here's what makes it work. The Mermaid code itself is clean and understandable — you can read the relationships directly without needing to render anything. But you also get the diagram, which lets you see the structure at a glance. For someone like me who thinks visually, having both is valuable.
The real payoff comes when you use tools like Replit. You can drop a Mermaid ERD directly into a new project as context, and Replit can use that as a baseline to generate your database structure. What used to take weeks of back-and-forth with developers to understand a system can now happen in a single conversation.
How I actually use this
For new projects, I'll describe what I'm building and ask the LLM to generate an ERD. I'm explicit about wanting data types and descriptions included — not because I need them to understand the diagram, but because they make the output more useful for downstream tools. The LLM might suggest tables and relationships I hadn't considered, or structure things in a way that sparks a better approach.
For existing projects, particularly when I'm joining a team or inheriting something complex, I'll ask the LLM to document the database structure. If I have schema files, I can feed those in directly. With agentic tools like Devin, you can ask it to read the project's schema and generate the diagram — it already has the context, you're just asking for a digestible output.
The key prompt addition: ask the LLM to include data types and field descriptions in the diagram. This serves two purposes. First, it makes the ERD more immediately useful to you when reviewing it. Second, it gives other LLMs better context if you're using the diagram to generate code or databases later.
The workflow in practice
I've been using this to build internal tools that are heading to production. Not side projects or quick prototypes — actual applications that need to be properly architected. That might sound reckless if you assume LLMs hallucinate nonsense, but that's not how this works in practice.
You're not blindly accepting whatever the LLM generates. You're using it to get further faster, then sense-checking the output. Does the structure make sense? Are the relationships correct? Do you agree with how it's modelled? If not, you ask it to change things. It's collaborative, not automated.
For new projects, the goal isn't to get the data model 100% correct on the first try. It's to have something concrete to discuss with your team, rather than starting from abstract conversation. For existing projects, the ERD becomes documentation — a map of how the system is structured, useful for understanding but not something you'd use to regenerate the database.
Example
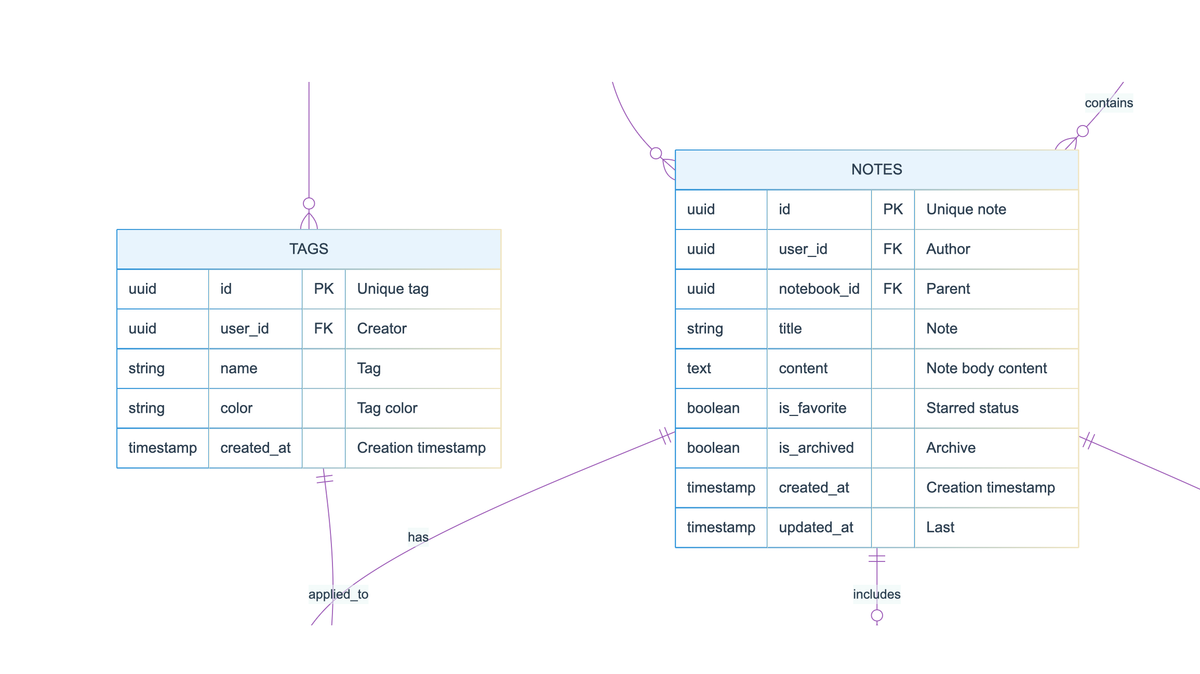
Here's an example diagram illustrating a note taking app. First pass, no edits. Not bad.
---
config:
  theme: base
  themeVariables:
    primaryColor: '#E8F4FD'
    primaryTextColor: '#2C3E50'
    primaryBorderColor: '#3498DB'
    lineColor: '#9B59B6'
    secondaryColor: '#FFF9E6'
    tertiaryColor: '#E8F8F5'
    background: '#FFFFFF'
    mainBkg: '#E8F4FD'
    secondBkg: '#FFF9E6'
    textColor: '#2C3E50'
    fontSize: 16px
  layout: dagre
---
erDiagram
	direction TB
	USERS {
		uuid id PK "Unique user identifier"
		string email  "User email address"
		string username  "Display name"
		timestamp created_at  "Account creation date"
		timestamp last_login  "Last login timestamp"
		boolean is_active  "Account status"
	}

	NOTEBOOKS {
		uuid id PK "Unique notebook identifier"
		uuid user_id FK "Owner reference"
		string title  "Notebook name"
		string color  "UI color code"
		integer sort_order  "Display order"
		timestamp created_at  "Creation timestamp"
		timestamp updated_at  "Last modified"
	}

	NOTES {
		uuid id PK "Unique note identifier"
		uuid user_id FK "Author reference"
		uuid notebook_id FK "Parent notebook"
		string title  "Note title"
		text content  "Note body content"
		boolean is_favorite  "Starred status"
		boolean is_archived  "Archive status"
		timestamp created_at  "Creation timestamp"
		timestamp updated_at  "Last modified"
	}

	TAGS {
		uuid id PK "Unique tag identifier"
		uuid user_id FK "Creator reference"
		string name  "Tag name"
		string color  "Tag color code"
		timestamp created_at  "Creation timestamp"
	}

	NOTE_TAGS {
		uuid note_id FK "Note reference"
		uuid tag_id FK "Tag reference"
		timestamp tagged_at  "Application timestamp"
	}

	ATTACHMENTS {
		uuid id PK "Unique attachment identifier"
		uuid note_id FK "Parent note reference"
		string filename  "Original filename"
		string file_type  "MIME type"
		integer file_size  "Size in bytes"
		string storage_path  "File location"
		timestamp uploaded_at  "Upload timestamp"
	}

	NOTE_VERSIONS {
		uuid id PK "Unique version identifier"
		uuid note_id FK "Parent note reference"
		text content  "Version content snapshot"
		timestamp created_at  "Version timestamp"
	}

	USERS||--o{NOTEBOOKS:"creates"
	USERS||--o{NOTES:"writes"
	USERS||--o{TAGS:"defines"
	NOTEBOOKS||--o{NOTES:"contains"
	NOTES||--o{NOTE_TAGS:"has"
	TAGS||--o{NOTE_TAGS:"applied_to"
	NOTES||--o{ATTACHMENTS:"includes"
	NOTES||--o{NOTE_VERSIONS:"tracks"
Where this fits with architects and developers
This isn't about bypassing the people who actually understand database design and system architecture. It's about getting to a shared understanding faster. When I can show up to a conversation with a developer or architect with a diagram that's 70% right, we can spend our time refining the 30% that needs work rather than starting from scratch.
The architects I work with appreciate this. It means I've done my homework, I understand enough to have an informed discussion, and we can move more quickly toward a usable, scalable product.
What to watch for
The main thing: always review what the LLM generates. If you're creating a diagram for a new project, you're looking for whether the structure makes logical sense and supports what you're trying to build. If you're documenting an existing system, you're checking whether it's accurately represented the relationships and data types.
I've found LLMs to be surprisingly reliable at this, but "surprisingly reliable" isn't the same as "always correct." The diagram is a tool to help you think, not a substitute for thinking.